Background
One of the problems that I faced in the recent months was using y labels that are unusually long in ggplot. I tried abbreviate command in R, which did the job but it was not an optimal solution to my problem. So after spending a few days, I was able to write a function that takes a list of string as input along with maximum number of words in each line, the output is the multiline.
Data
For the illustrative purposes, I used the following data.
#Downloaded and saved the data locally
data <- fread("Transport_Policy_instruments.csv")
My objective is to look at the category name and Sub schemes by Country. First, let’s see what are the unique category name in the data.
unique(data[,`Category name`])
[1] "Fee/Charge"
[2] "Tax"
[3] "Environmentally motivated subsidies"
[4] "Voluntary approaches"
Now, let’s make a plot.
ggplot(data[, .N, by = .(Country, `Category name`)],
       aes(x = Country, y = `Category name` , size = N)) +
  geom_point() +
  theme(axis.text.x = element_text(angle = 90, hjust = 1),
                         axis.text.y = element_text(angle = 45, hjust = 1)) +
  scale_size("Count")+ theme(legend.position = "bottom")
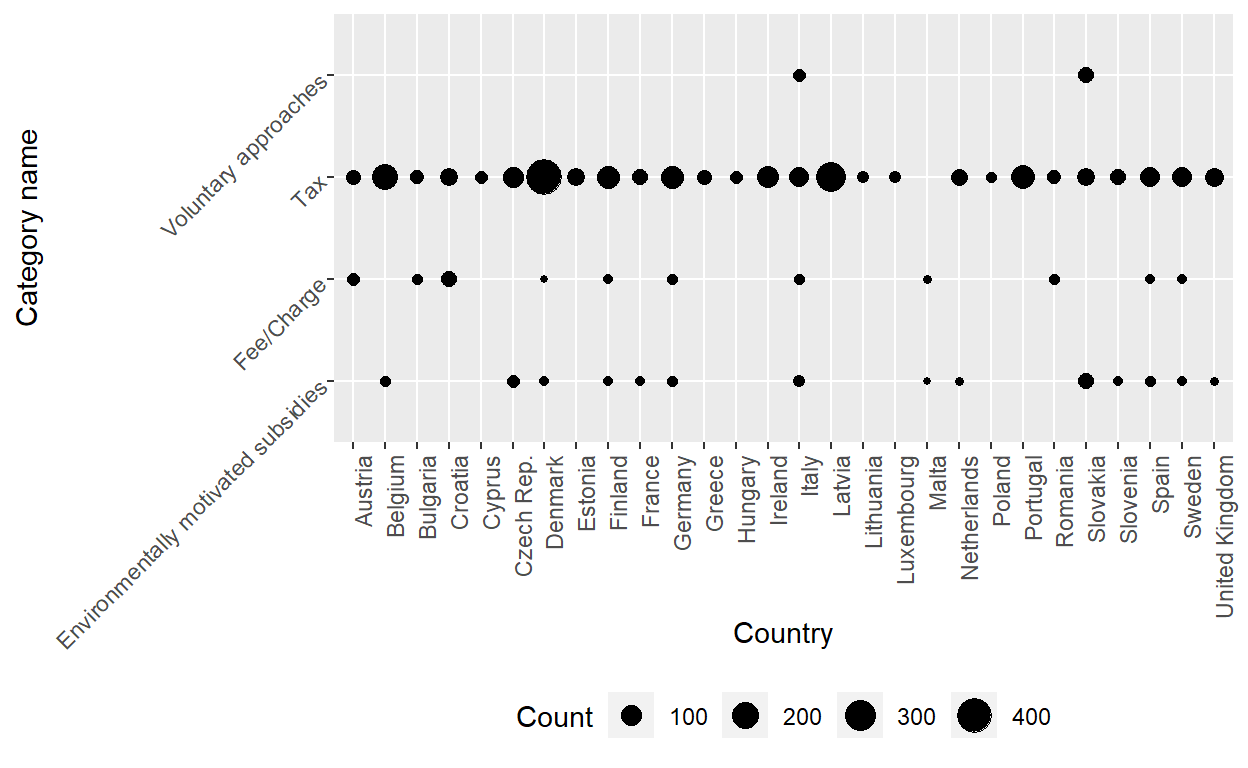
As you can see, the y-label is too long making the plot look a little bit off. We can use the labels in scale_y_discrete option in ggplot. The function is below:
#length.cutoff is the number of words ine ach line
string_multiline <- function(StringToChange, length.cutoff){
  labels_ <- c() #to store the multilines

  for (j in StringToChange){ #list of strings to convert

    if (length(as.list(strsplit(j, " ")[[1]])) <= length.cutoff){
      labels_ <- c(labels_, j) #check to see if the string needs to be converted
      next
    }

    cf.split <- as.list(strsplit(j, " ")[[1]])
    cf.length <- length(cf.split)

    quo <- cf.length%/%length.cutoff
    remainder <- cf.length%%length.cutoff


    a <- ""
    start <- c(1)

    for (i in 1:quo){
      a <- paste( a, paste(cf.split[
        start: (i * length.cutoff)], collapse = " "), collapse = "")
      a <- paste(a, '\n', sep ="")
      if ( i == quo){
        if ( remainder > 0){
          a <- paste(a, paste(cf.split[
            ((i * length.cutoff) + 1) :cf.length], collapse = " "), collapse =" ")
          a <- str_trim(a)
        }
      } else {
        start <- (i * length.cutoff) + 1
      }
    }
    labels_ <- c(labels_, a)
  }

  return(labels_)
}
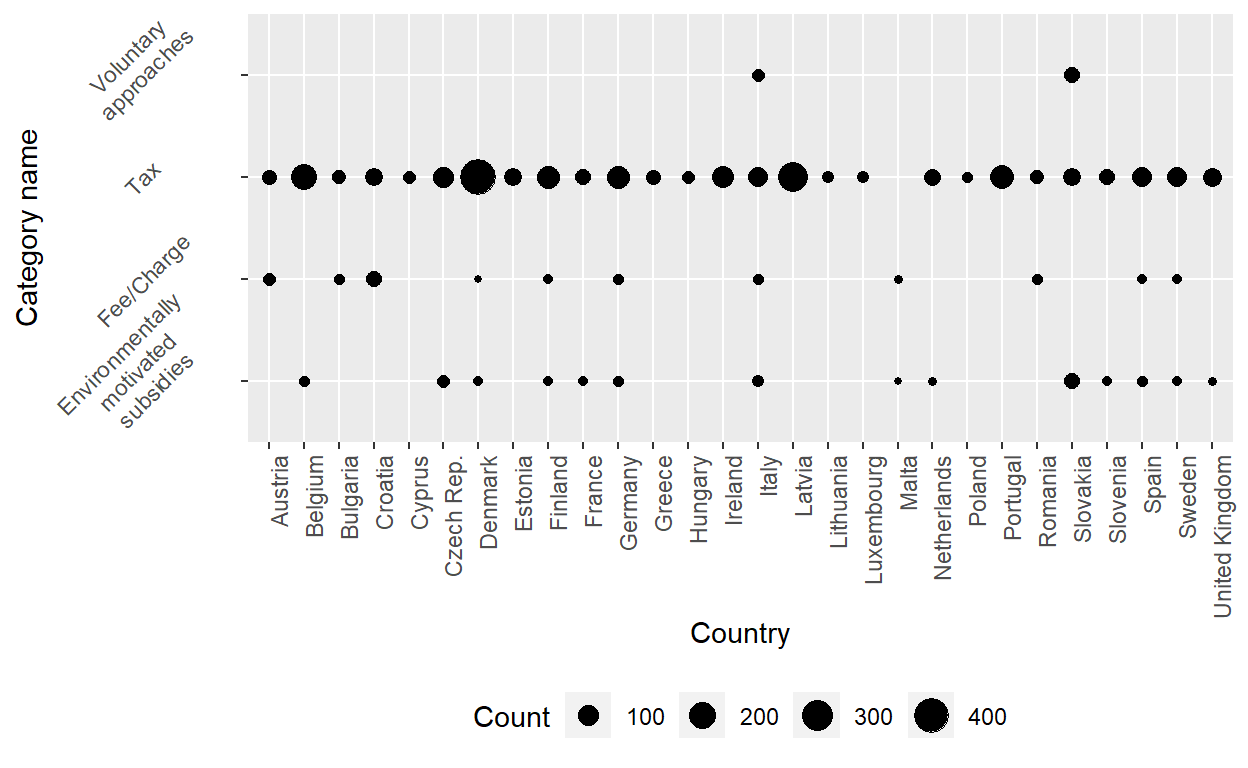
Now, let’s see if the function to change the y lables works or not. First, let’s use length.cutoff as 2.
ggplot(data[, .N, by = .(Country, `Category name`)],
       aes(x = Country, y = `Category name` , size = N)) +
  geom_point() +
  scale_y_discrete(labels = function(x) string_multiline(x, 2)) +
  theme(axis.text.x = element_text(angle = 90, hjust = 1),
                         axis.text.y = element_text(angle = 45, hjust = .5)) +
  scale_size("Count")+ theme(legend.position = "bottom")

Just to make sure, let’s change the length.cutoff to 1.
After all the time I spent on this, I later found out that there is a command in stringr package str_wrap that does the exact same thing. But the only difference is that instead of words counts on each line, the str_wrap command uses the width. See the code below:
ggplot(data[, .N, by = .(Country, `Category name`)],
       aes(x = Country, y = `Category name` , size = N)) +
  geom_point() +
  scale_y_discrete(labels = function(x) str_wrap(x, 15)) +
  theme(axis.text.x = element_text(angle = 90, hjust = 1),
                         axis.text.y = element_text(angle = 45, hjust = .5)) +
  scale_size("Count") + theme(legend.position = "bottom")
