Background
Traffic safety is one of the important facets in transportation engineering. Many initiatives have been undertaken by various Department of Transportation agencies in the United States to make commuting safer. In recent times, the potential of autonomous and connected vehicles in improving the safety aspects of road transportation is being considered and initiatives are developed taking advantage of their benefits.
Most of these initiatives are still being on the initial stages. Therefore, the jury is still out on how connected and autonomous vehicles will help reduce the traffic related accidents. On a abstract level there are two main types of research conducted in the traffic safety research: a) finding the hotspots, i.e. the locations along the roadways where more accidents tend to happen, and b) assessing the effects of the combination of driver, vehicle, and environmental characteristics on the crash frequency. In general, an accident can be broadly categorized into two kinds:
- fatal accidents (no deaths)
- non-fatal accidents (vehicle damages and/or injuries)
Data
In this post, as a first step, I ventured to see if there are any temporal differences in the occurrence of fatal accidents. The time time period chosen was five years, from 2016 to 2020. The shape files data can be downloaded from here. As for the fatal crashes data for 5 years, I downloaded the data from here. The data is for all the states in the United States. You need to subset the data for the chosen state. In my case, I selected Florida. The reason is to identify the effects of topography, if any, by comparing it with say Utah, which has different terrain than Florida. I will post the analysis and results in my future posts.
Analysis
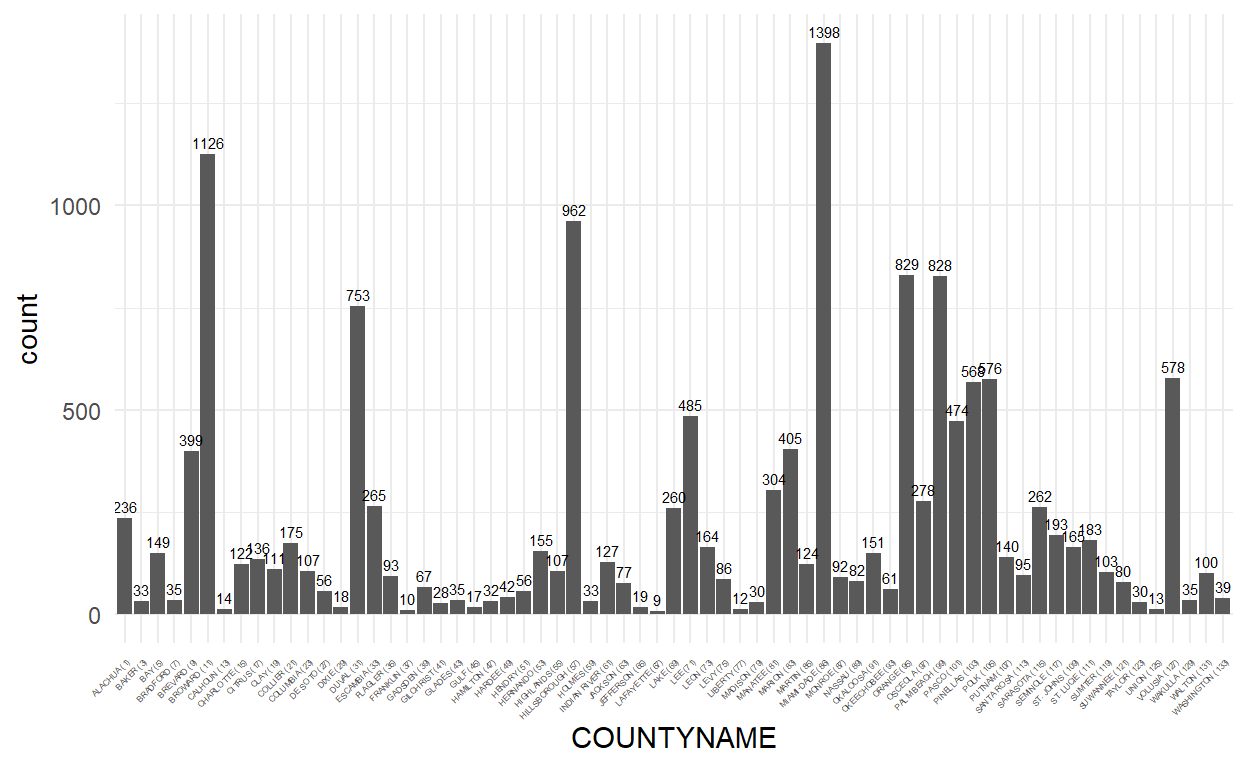
The first step is to see how fatal crashes distributed across different counties in Florida. I am looking at the total fatal crashes recorded within the selected time period of 5 years. At this point, we just want to know which counties have the highest recorded fatal crashes in Florida.
files = list.files("./AccidentData")
data = sapply(paste0("./AccidentData/", files), read_csv)

#Combining the data from all selected years
CombinedData = rbindlist(data, fill = TRUE)

#Subset the data for Florida
FloridaCrashData = CombinedData %>% filter(STATENAME == 'Florida')
The plot above included all the crash count for all the selected years. However, in order to statistically test the temporal difference, I decided to use a simple trend change identification test, Mann-Kendall Test. The test can be applied to find if the series either follows a monotonically increasing (decreasing) trend or not. In our case, we need to find if the series, i.e. the crash counts over the five year period, either follows a monotonic trend or not. If the series does not follow a monotonic trend then we can say that there is no temporal difference in crash count. I must admit that the series only contains 5 points, more points would give a better estimation. Therefore,
- Null hypothesis: No trend is observed
- Alternate hypothesis: A trend is observed (could be increasing or decreasing)
Let’s look at the counties where there is a trend (either increasing or decreasing) in the series. We can just filer the P_Value column with the condition that the p-value is less than 0.05. I used the 95% confidence interval. So, if the county has a p-value less than 0.05, then it means that there is a trend detected in the given series. Therefore, the crashes at those counties were either increased or decreased over the years.
From the above table, we can see that three counties in Florida the fatal crash frequency over the period of 5 years have seen a decreasing trend. This result itself gives as the opportunity to focus on these counties to see if they have implemented any traffic safety policies that caused this decreasing trend. We can also compare these counties with neighboring counties to see the differences in the selected variables. For now, I will select the Brevard county for plotting the locations of the crashes. The number right next the county name (9) is the county number. I have already downloaded the roads shapefiles for Brevard county. I will filter the FloridaCrashData by setting the COUNTY variable equal to 9, and select the columns Latitude and Longitude.
FloridaCounties009 = st_read("./newfolder/tl_2020_12009_roads.shp", quiet = TRUE)

#Define the desired projection
proj = "+proj=utm +zone=17 +ellps=GRS80 +towgs84=0,0,0,0,0,0,0 +units=m +no_defs +type=crs"
#Projecting the shapefile to the defined projection
FloridaCounties009Proj = st_transform(FloridaCounties009, crs = proj)

#Creating spatial object from the latitude and longitude information in the FloridaCrashData
CrashLocations = FloridaCrashData %>%
  select(COUNTYNAME, LONGITUD, LATITUDE, TWAY_ID, TWAY_ID2, YEAR) %>%
  filter(grepl("BREVARD", COUNTYNAME, ignore.case = TRUE)) %>%
  st_as_sf(., coords = c('LONGITUD', 'LATITUDE'), crs = 4269)
tm_shape(FloridaCounties009Proj) + tm_lines() +
  tm_shape(CrashLocations) + tm_dots(size = .04, col = 'green') +
  tm_facets('YEAR')

So, that’s it for this post. In the next post, I will create a road networks graph of BREVARD county to extract the intersection information. Then, overlay the above map to identify the intersections closest to the crash locations. The idea is to use the intersection characteristics to study the effect of them in crash frequency.