Posts
Analysis of Fatal Traffic Crashes in Florida: Part 2
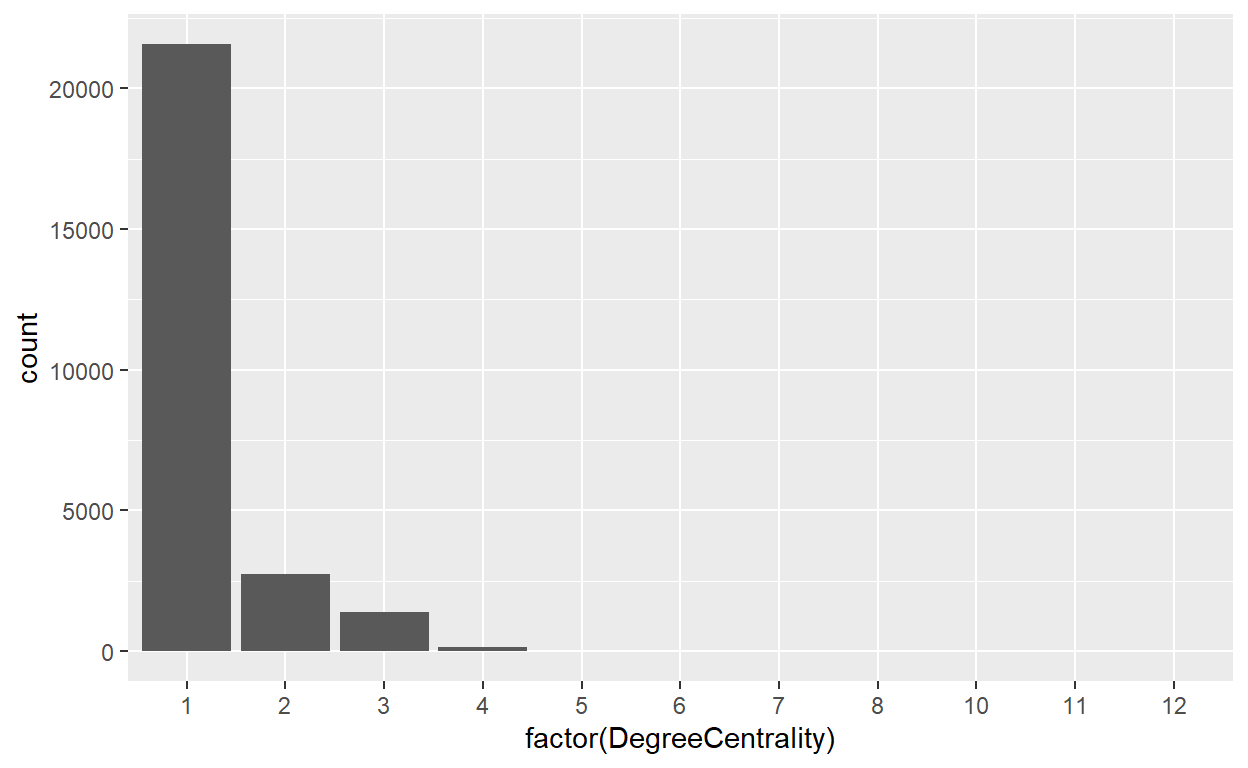
This post is a continuation of post "Analysis of Fatal Traffic Crashes in Florida: Part 1." In this post, I will identify road intersections closest to the crash locations in Brevard County, Florida, as an example.
Analysis of Fatal Traffic Crashes in Florida: Part 1
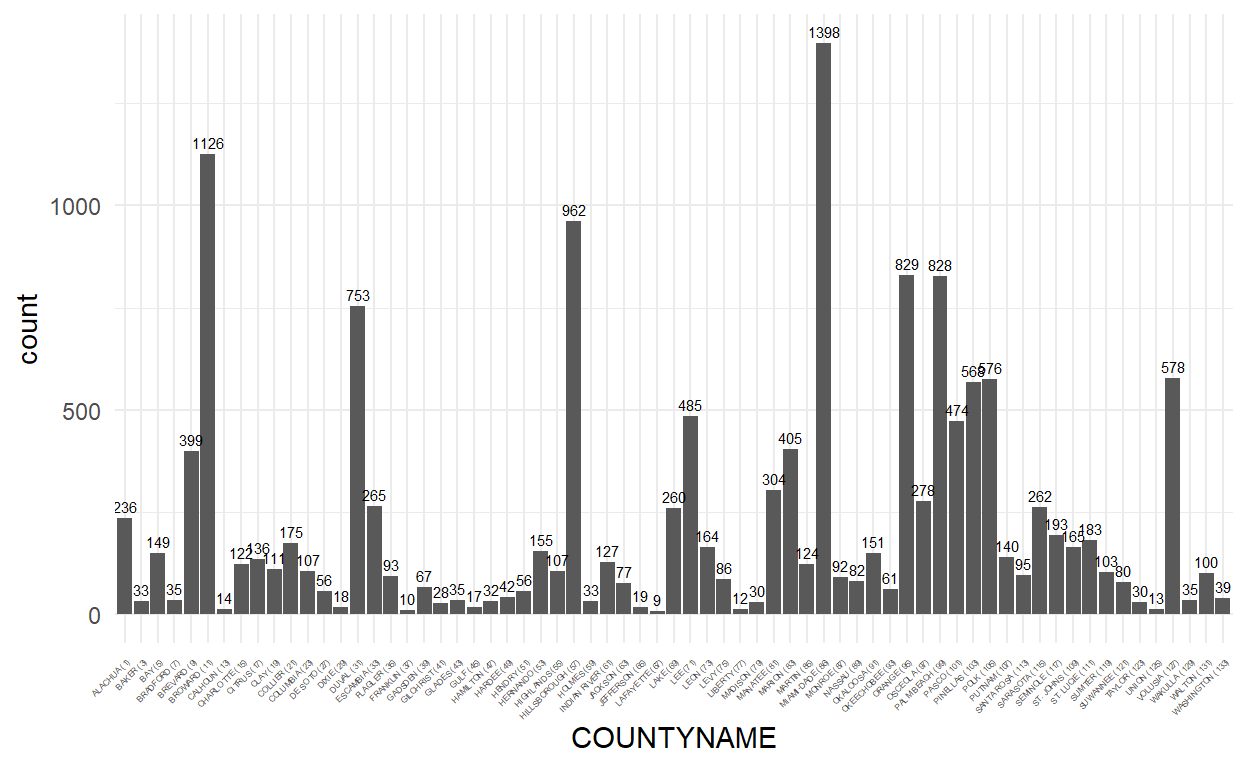
In this post, I will look at the the fatal accidents over a period of five years in Florida at different counties to see how the crash rate varies over time. Moreover, I will use a statistical test to identify counties where there is an increase or decrese in crash rate. Finally, I will plot the locations of the crashes, and identfy the nearest road intersections for an example county. Finally, overlay the accidents and intersection locations and visualize it using **tmap** package.
Creating Multiline Labels in R ggplot
In this post, we will create a function that takes a string and create a multiline output, which we will then use it for x and y lables of a ggplot.
Visualization of US Domestic Freight Transport of Different Commodities Originating From Illinois
In this post, we will visualize the domestic freight transport flow of different commodities from Illinois to other US mainland states.
Extracting Information from 10Q filings
In this post, I explain how to extract financial information (statement of balance sheet) of **Apple Inc.** company from its third quarter 10Q filing for the year 2018.